Results
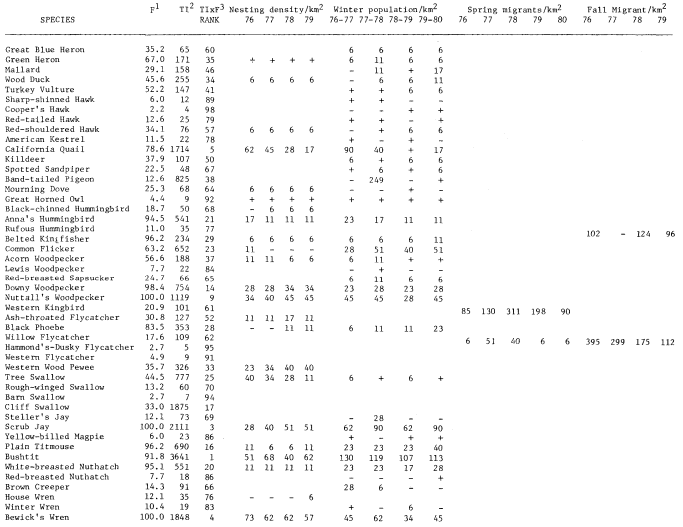
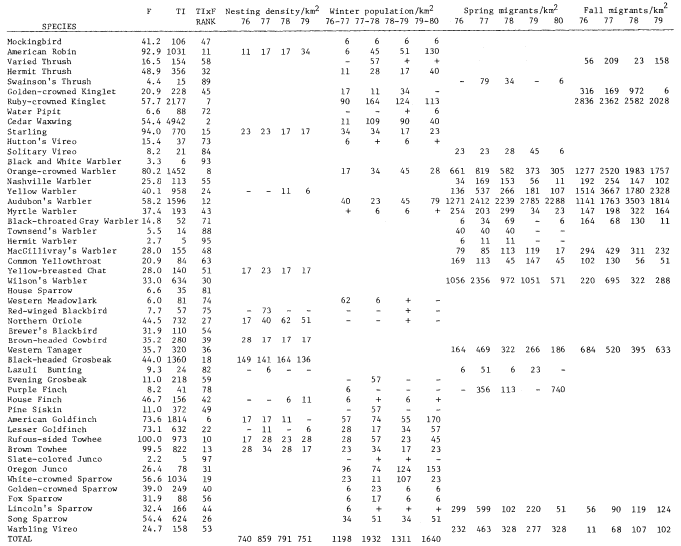
A total of 147 species of birds were recorded during the censuses. The 98 species listed in table 1 occurred regularly. This table shows TI, F, Rank, and nesting, winter, and estimated migrant populations. The two forms of Yellow-rumped Warbler and Dark-eyed Junco are treated as separate taxa. Scientific names of the birds are not included to save space.
Species Diversity
Species diversity (H') is a concept which indicates both the richness and evenness of the members of a plant or animal community. It is mainly used to compare the diversity of one system or area to another.
Robert MacArthur (1972) used this formula to compare bird species diversity (BSD) with foliage height diversity (FHD) (MacArthur and MacArthur 1961). He found that FHD explained BSD better than plant species diversity or any other habitat parameter that he measured. This theory has been widely tested and has held in many cases (Balda 1975).
|
|
Species diversity of the nesting pairs on the study area was figured for each year, 1976 through 1979 (table 2). The average for the four years was 3.00 and the FHD was 1.08. All nesting BSD figures were higher than predicted using MacArthur's graph. This is not at all surprising since the study area was 17.7 ha., as compared to 2-ha. areas used by MacArthur (1972). A larger area will generally have more species nesting, and therefore will have a larger BSD. A sample of three 2-ha. plots was chosen from the 1979 nesting census data. BSD figures of 2.05, 2.40, and 2.70 were calculated for those plots. The latter two figures fit into MacArthur's linear regression, but the first figure falls well below any of his results. It is possible that the FHD was not the same for these small plots as for the whole study area.
Comparison of BSD at different seasons is also possible. When comparing the nesting and wintering population BSD, the wintering BSD was considerably higher, but shows less evenness. This is misleading due to the averaging of 6–12 census dates to obtain the wintering population figures. In order to make valid comparisons between winter and nesting populations, I chose two winter and two summer census weeks and again obtained a higher BSD on the winter samples. This was due mainly to a higher number of species, since the evenness was very similar (table 2).
| ||||||||||||||||||||||||||||||||||||||||||||||||||||||||||||||||||||||||||||||||||||||||||||||||||||||||||||||||||||||||||||||||||
BSD's for spring and fall census weeks were also calculated. A great deal of difference from week to week for both BSD and evenness was obtained. Overall, summer had the lowest BSD and spring, the highest. This is not surprising since the spring census weeks had the highest number of species and the summer census weeks had the lowest (table 2). When comparing weeks 16 (16–22 April) and 19 (7–13 May), the BSD was much lower during week 19 even though the species total was the same due to the large influx of Cedar Waxwings. Increased numbers of one species will always decrease the BSD.
Seasonal Changes
Figure 2 shows the changes in numbers of birds and in the total and average numbers of species from week to week, averaged over the combined 5-year period of study. The total number of species is a summation of all species found during each week for the five years of the study. The averge number of species is the average number recorded on all censuses during each week over the 5-year period. The peaks and dips in the three lines do not occur in the same places.
Total number of species (species) and average number of individuals (individuals) held relativey constant from the beginning of the year through week 5 (29 Jan.–4 Feb.). In week 6 (5–11 Feb.) and 7 (12–18 Feb.) individuals dropped while species held steady. The drop in individuals was due to a reduction in Band-tailed Pigeons in 1978. During week 8 (19–25 Feb.) individuals began to climb, reaching a peak on week 10 (5–11 Mar.). This peak was due to large increases in swallows, Audubon's Warblers, and American Goldfinches.
Species began to swing upward on week 9 (26 Feb.–4 Mar.) and rose to a peak on weeks 15 to 17 (9–29 Apr.) as spring migration was in full swing. Species dropped from weeks 17 (23–29 Apr.) through 24 (11–17 June) as the wintering species left and migrants passed through, leaving only the summer residents.
On the other hand, individuals dropped from week 10 (5–11 Mar.) through week 14 (2–8 Apr.) as the numerous Band-tailed Pigeons, Audubon's Warblers, and American Goldfinches left the area. Individuals then rose again through week 18 (30 Apr.–6 May) with migrant Cedar Waxwings, Wilson's Warblers, and Black-headed Grosbeaks making large increases. Individuals declined steadily through week 24 (11–17 June) as the migrants and winter residents left.
On week 26 (25 June–1 July) both individuals and species began to rise due to the fledging of young and influx of the first fall migrants. On week 28 (9–15 July), with species still rising, individuals began to fall as the swallows left. Individual continued to fall through week 33 (13–19 Aug.) as the common summer residents (Western Wood Pewee, Northern Oriole, and Black-headed Grosbeak) left. At the same time, species continued to rise as early migrants moved through.
Species peaked from weeks 35 to 37 (27 Aug.–16 Sept.) and then again on week 43 (22–28 Oct.) as the early and late waves of migrants passed
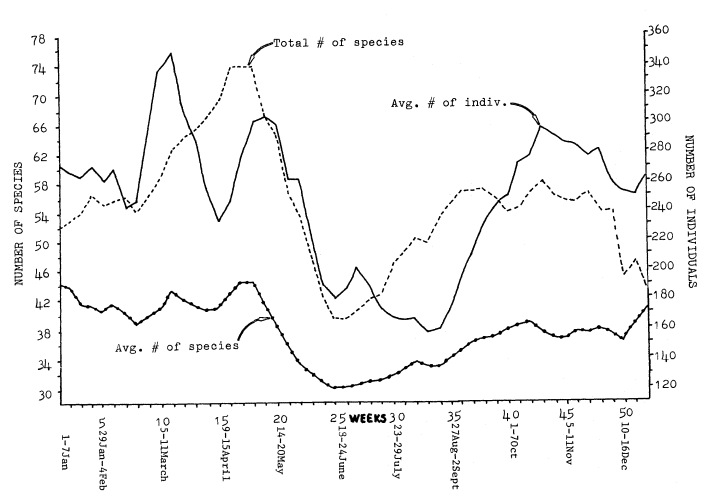
Figure 2.
Variations in numbers of species and individuals (three-week running average) for 1975 through 1979.
through. Individuals began to rise on week 34 (20–26 Aug.) and continued to go up until a peak on week 43 (22–28 Oct.) was reached. This was caused first by large numbers of Orange-crowned Warbler and Yellow Warbler, and later by an in-flux of Ruby-crowned Kinglet, Cedar Waxwing, and Audubon's Warbler. Individuals and species then dropped gradually to week 50 (10–16 Dec.).
The difference between the average number of species and total number of species was greatest during migration, and smallest during winter and summer. This was caused by a greater chance of rarities during migration, and differences in migration timing from year to year. An average of not more that 45 species was found on any week, but the chances of new species occurring on censuses during that week in succeeding years were greatest during migration.
Nesting Season
The lowland riparian nesting avifauna in central California is quite rich. A total of 83 species have been documented as nesting in the riparian areas of the Sacramento Valley in the past 100 years. Five species (Common Merganser, Spotted Sandpiper, Western Wood Pewee, Starling, and Brown-headed Cowbird) have colonized the area; and 11 species (Double-crested Cormorant, Cooper's Hawk, Bald Eagle, Long-eared Owl, Willow Flycatcher, Western Flycatcher, Purple Martin, Swainson's Thrush, Blue-gray Gnatcatcher, Bell's Vireo) have become either very rare or extirpated during that time (Gaines 1974).
Of these 83 species, 35 were found breeding on Dog Island during the study interval. An average of 29.5 species nested each year (range 27 to 31). Twenty-five species nested in all four years, two nested in three years, four nested in two years, and four nested once. Of the 10 species not found every year, five (Black-
chinned Hummingbird, Black Phoebe, House Wren, Yellow Warbler, and House Finch) colonized the area during the study. Two species (Common Flicker and American Goldfinch) became extinct as nesting species, and three species (Red-winged Blackbird, Lazuli Bunting, and Lesser Goldfinch) both colonized and became extinct as nesting species during the study.
The most abundant nesting species were the Black-headed Grosbeak, Bewick's Wren, and Bushtit. The total number of nesting birds averaged 139 pairs in 1977. In most cases, the numbers of nesting pairs of each species varied little from year to year. Notable exceptions were California Quail and Tree Swallow which declined; and Western Wood Pewee, Scrub Jay, American Robin, and Northern Oriole, which increased.
The origin of the nesting pairs was 50% residents, 13% short-distance migrants, and 37% long-distance migrants. The origin of the 35 nesting species was 44% residents, 28% short-distance migrants, and 28% long-distance migrants. Of the unstable species (i.e., those colonizing or becoming extinct), four were long-distance migrants. Only the Black Phoebe was a resident. This indicates a very unstable situation for migrants, with 45% colonizing or becoming extinct in four years.
Nesting guilds were devised on the basis of the type of nesting situation used. The avian community nesting guild composition is presented in table 3. The proportion nesting on the ground was quite low, considering the dense groundcover. This was not surprising however, since ground nesting is dangerous (Skutch 1976). The proportion of tree-hole nesters was high. This was undoubtedly a result of the large number of snags and decadent trees on the plot. These provided sites for woodpeckers to excavate their homes which in turn provided homes for the secondary cavity nesters. Many of the live trees also had natural cavities from broken-off limbs.
| |||||||||||||||||||||
Spring and Fall Migration
Each year gave a different overall impression of migration. Much of this impression came from the presence or absence of irruptive species, but much also came from the actual timing and numbers of migrants.
To gain some insight into the spring migration differences over the years, I used two criteria: 1) migration timing; and 2) actual numbers. The species accounts (Laymon 1981) and estimated spring migrant numbers (table 1) were examined for six categories: 1) record high totals; 2) record low totals; 3) record early arrival date; 4) record late arrival date; 5) record early departure date; and 6) record late departure date. The number of species that set records in any category in any year was recorded (table 4). From a birdwatcher's standpoint, 1977 was clearly the "best", since more species arrived earlier, left later, and set records for numbers. Just as clearly, 1980 was the "worst" spring, with more species arriving later, leaving earlier, and setting record low numbers. The three years 1976 through 1979 all had many early and three late departure dates, indicating a mixed situation.
Fall migration was analysed in the same manner (table 4). Late and early arrival and departure dates seemed to have little relation to the general timing of migration in fall. This was because fall migration is a much more relaxed affair. Migration timing is much less precise than in the spring. As a result, very little pattern was revealed in this portion of the analysis except that 1979 had the most early arrivals and the fewest late arrivals, and 1976 was just the reverse. The record high and low numbers revealed that 1977 had the most highs and no lows, 1976 and 1979 had the least highs and the most lows.
| ||||||||||||||||||||||||||||||||||||||||||||||||||||||||||||||||||||||||||||||||||||||||||||||||||
Winter Populations
Winter populations varied from one year to the next, much more so than breeding populations. The difference between the highest and lowest breeding years was only 14%, while the difference between the highest and lowest wintering populations was 38%. The higher totals in 1977–78 were caused almost exclusively by irruptive species such as Band-tailed Pigeon, Steller's Jay, Varied Thrush, Cedar Waxwing, Evening Grosbeak, and Pine Siskin.
Examination of a sample of 25 regularly occurring, non-irruptive species revealed that the winter of 1979–80 actually had the highest wintering population, with an average of 229 individuals per survey. The winter of 1976–77 had 160 individuals, 1977–78 had 198 and 1978–79 had 178 individuals per survey. This was still a 30% difference between the highest and lowest years. Variations in food supply, temperature, rainfall, and floodwaters must have been responsible for some of the variation in bird numbers. Much may also have been caused by nesting success and food supply on the breeding grounds.